cost-effectively converting data into actionable insightful visuals
Projects
TRUST US TO TRANSFORM YOUR UNIQUE DATA
We work on many ‘Project X’s’ for our clients, transforming confidential data into meaningful insights to improve targeting, sales and profitability
UK 4 nations prescription data and other NHS Open Data sourced for you
We have combined our data and Pharmaceutical expertise to develop our service enabling us to provide you Government Open NHS prescription data. Please contact us for more information.
England, Northern Ireland, Scotland and Wales prescriptions:
Accessed under Open Government Licence v 3
Full list price medicines costs across 25,000 medicines
Codes matched across the 4 nations
Latest 13 months data at a national level
More granular levels of data available – ICB, PCO, PCN and GP Practice and also NHS Trusts in England
We provide our clients with interactive maps and reports which help visualise data and offer actionable insight, specific detail and measurable ROI
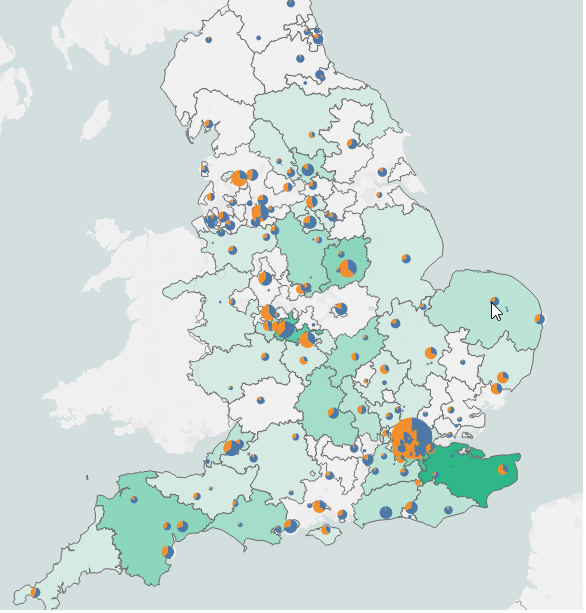
Mapping layers of data
We are constantly exploring new ways of overlaying different datasets utilising the latest features in Tableau. This example combines Primary Care data with Secondary Care Hospital information to investigate links between prescribing influences. We use mapping to restructure sales territories, identify geographic hot spots, unravel high potential areas and much more.
Let us take the hard work out of visualising data for your business
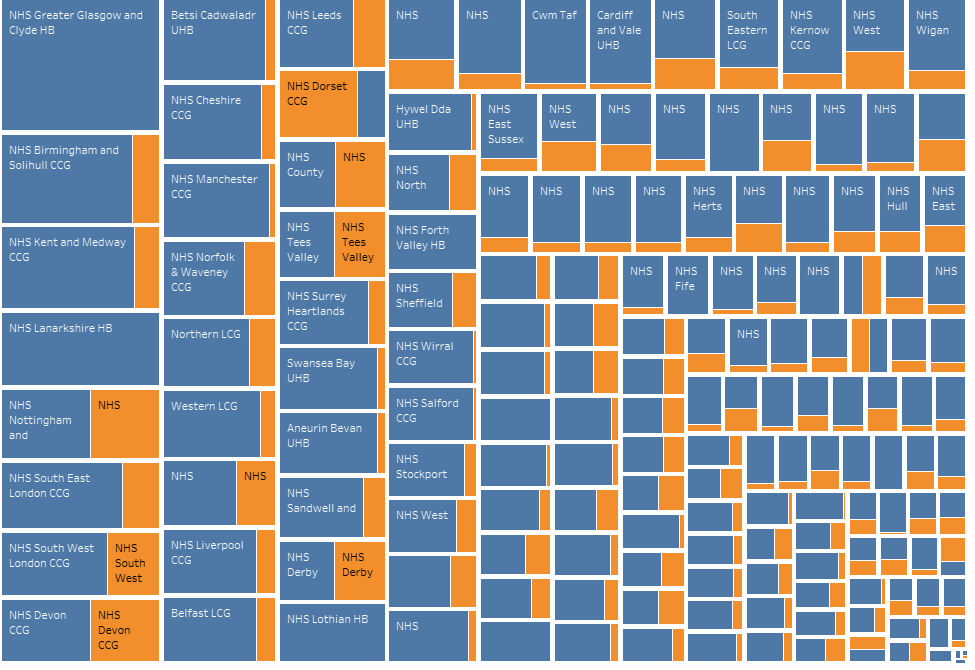
Market snapshots to help you quickly see the big picture
We are always looking for creative solutions to visualise large amounts of data to show you the big picture, but we also identify high, low, growth and other interesting measures in the data to help you take focused actions
Let us combine our creativity and BI expertise to cost-effectively reveal actionable insights
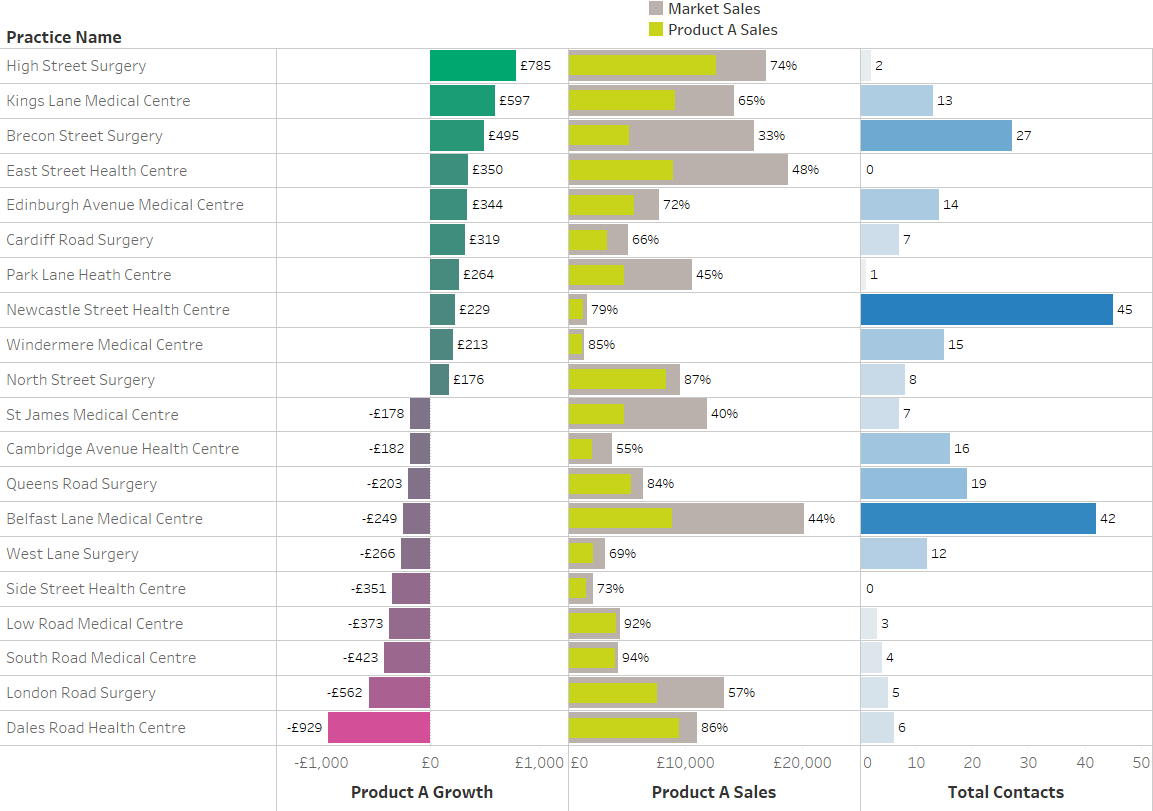
Combine different measures to reveal effort result patterns
We are experts in combining multiple data sets into single dashboards to reveal illustrative patterns in sales, market share, growth, activity, etc
Augment your business intelligence by combining multiple data sets
To discuss your specific data insight project challenges, please contact us for a FREE no obligation phone consultation